

How Users Really See Your Website: Attention Research
Most UX problems don't start where teams go looking for them. They start with one wrong assumption: that users look at a website the way we do.
In reality, visitors don't study an interface. They don't read the copy in order, analyse the page structure or try to understand the designer's logic. Their brain does something else entirely: it looks for the shortest route to the goal. It recognises a familiar pattern, latches onto the most prominent element and tries to finish the task with as little effort as possible.
That is why a tidy, good-looking website can still fail. People don't see the call-to-action button, skip important blocks, get lost in long flows and run out of energy before they act. Most of these mistakes are hard to spot by eye, because whoever built the site already knows where everything is.
In this guide we explain:
- how the brain saves attention when it meets a new website;
- why even important elements get lost;
- when impressive design starts to feel tiring;
- what eye tracking, skin response and heart-rate measurements teach us;
- why teams almost always overestimate how much attention users give them;
- how to build a website that is easy to take in, and which tools you can use to test it without a lab.
Users don't read your website, they scan it
A common illusion in UX is still alive: if information is on the screen, the user will see it. That is not how it works. People scan an interface in fragments and pick up only what seems useful at that moment. The brain filters out everything else as fast as it can.
Eye-tracking studies keep showing the same picture. When users are given a simple task, such as finding a price, opening hours or a contact number, their attention clusters around quick, concrete signals: headings, numbers, cards, navigation buttons and blocks with obvious labels like "How to order" or "Pricing".
Long descriptive paragraphs, on the other hand, are barely read. At best, the eye stops on the first sentence and moves on. This is especially visible on long landing pages: as soon as visitors find the answer to their main question, their motivation to keep scrolling drops sharply.
The F-pattern and what it means for your layout
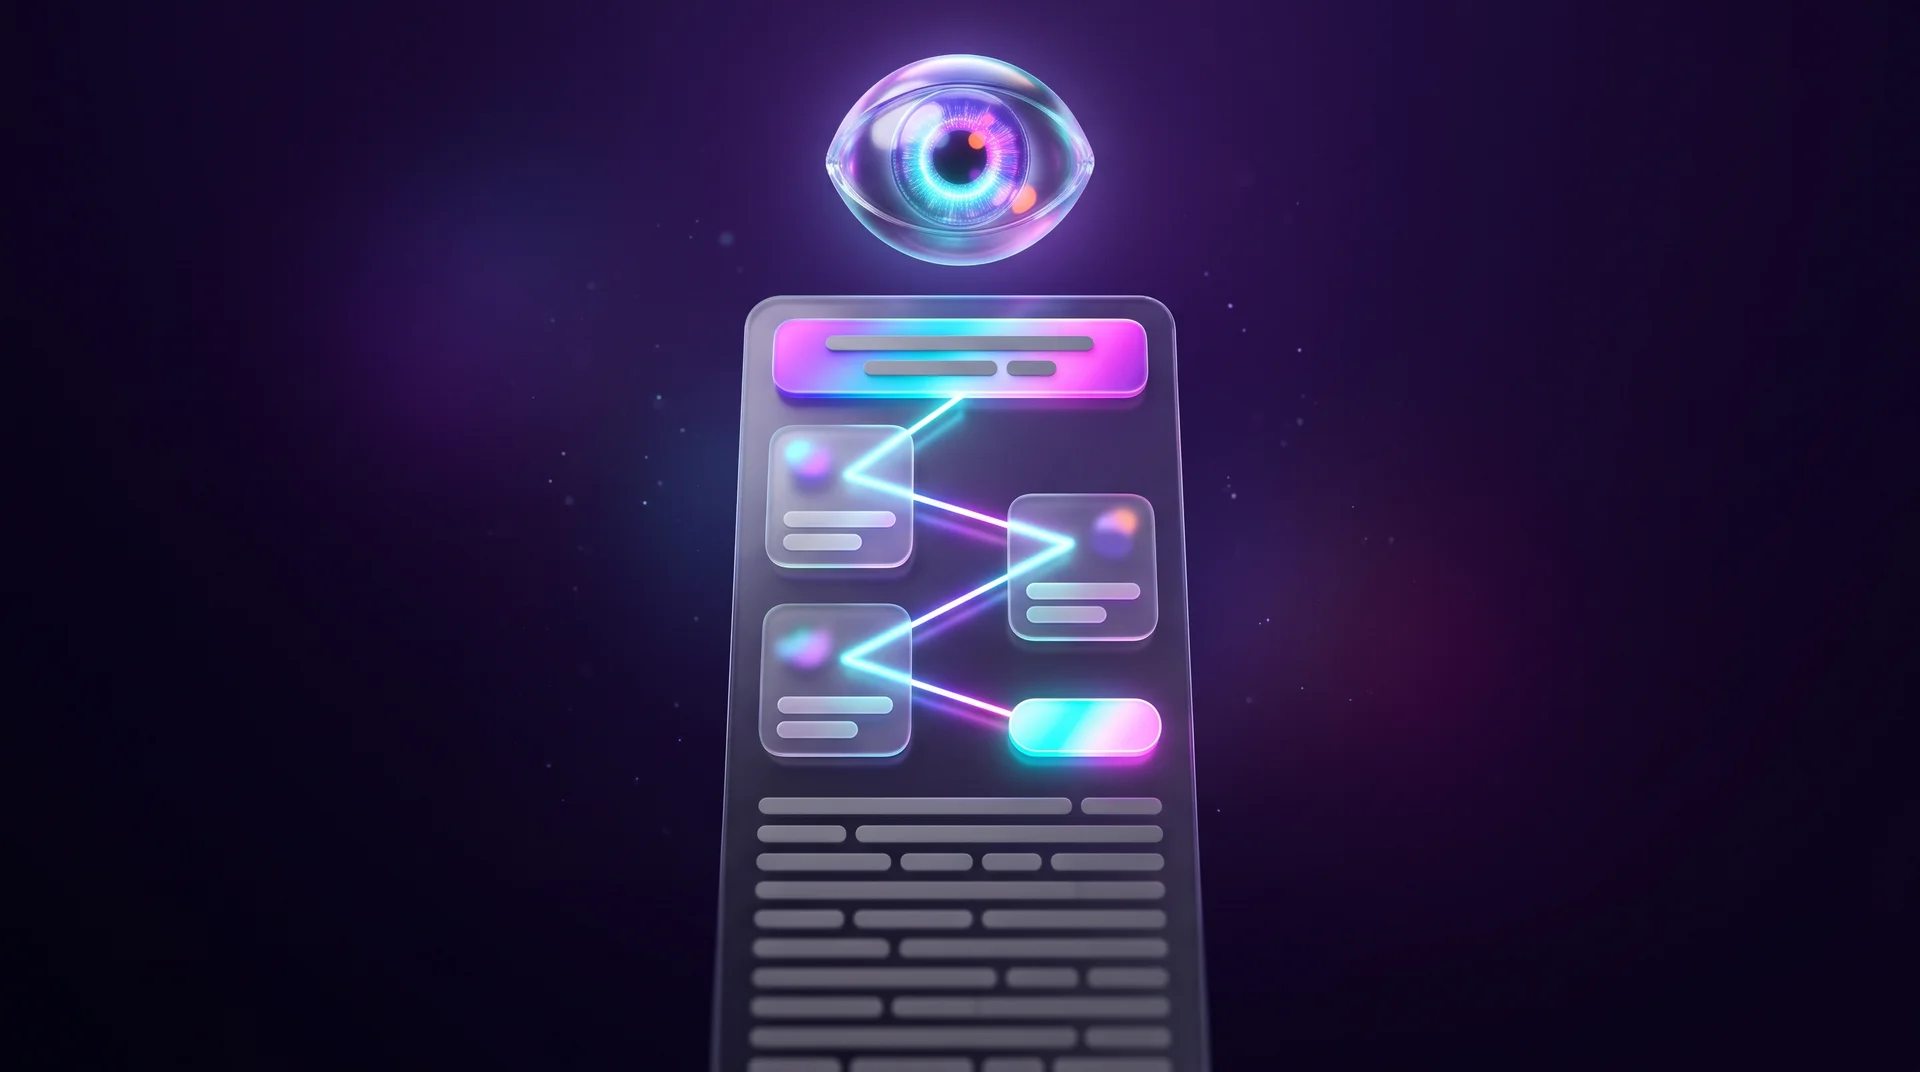
As early as 2006, researchers at Nielsen Norman Group described what became known as the "F-pattern": the eye moves horizontally across the top of the page, then horizontally again a little lower, and then travels down one side, catching only the beginnings of lines. Other scanning patterns have been described since, for example "layer-cake" scanning that jumps between subheadings only, but the principle is the same: people don't read, they look for anchors.
In left-to-right languages, the natural starting point is the top-left corner, and the beginnings of lines sit on the left. In right-to-left languages, such as Arabic, the whole pattern is mirrored. Either way, the practical takeaway is identical: whatever really matters should appear at the start of the line, the start of the paragraph and the start of the heading, not at the end.
What this means for business owners
It is an uncomfortable conclusion. You can spend weeks polishing messages, storytelling and benefit descriptions, but visitors don't come to your website for the full picture. In most cases they want a quick answer to one question. If that answer is buried in the fourth paragraph, they will never reach it.
Why users miss even the important elements
One of the most interesting findings from attention research: a user can fail to see an element sitting right in the middle of the screen.
This happens mostly in busy interfaces, where several elements compete for attention at the same time. When a page has too many accents, the brain stops being able to tell what matters from what doesn't. You can see this clearly in gaze paths: instead of a smooth movement, attention starts jumping between blocks, and the user scans the screen chaotically, trying to find something to hold on to.
When the whole card looks clickable
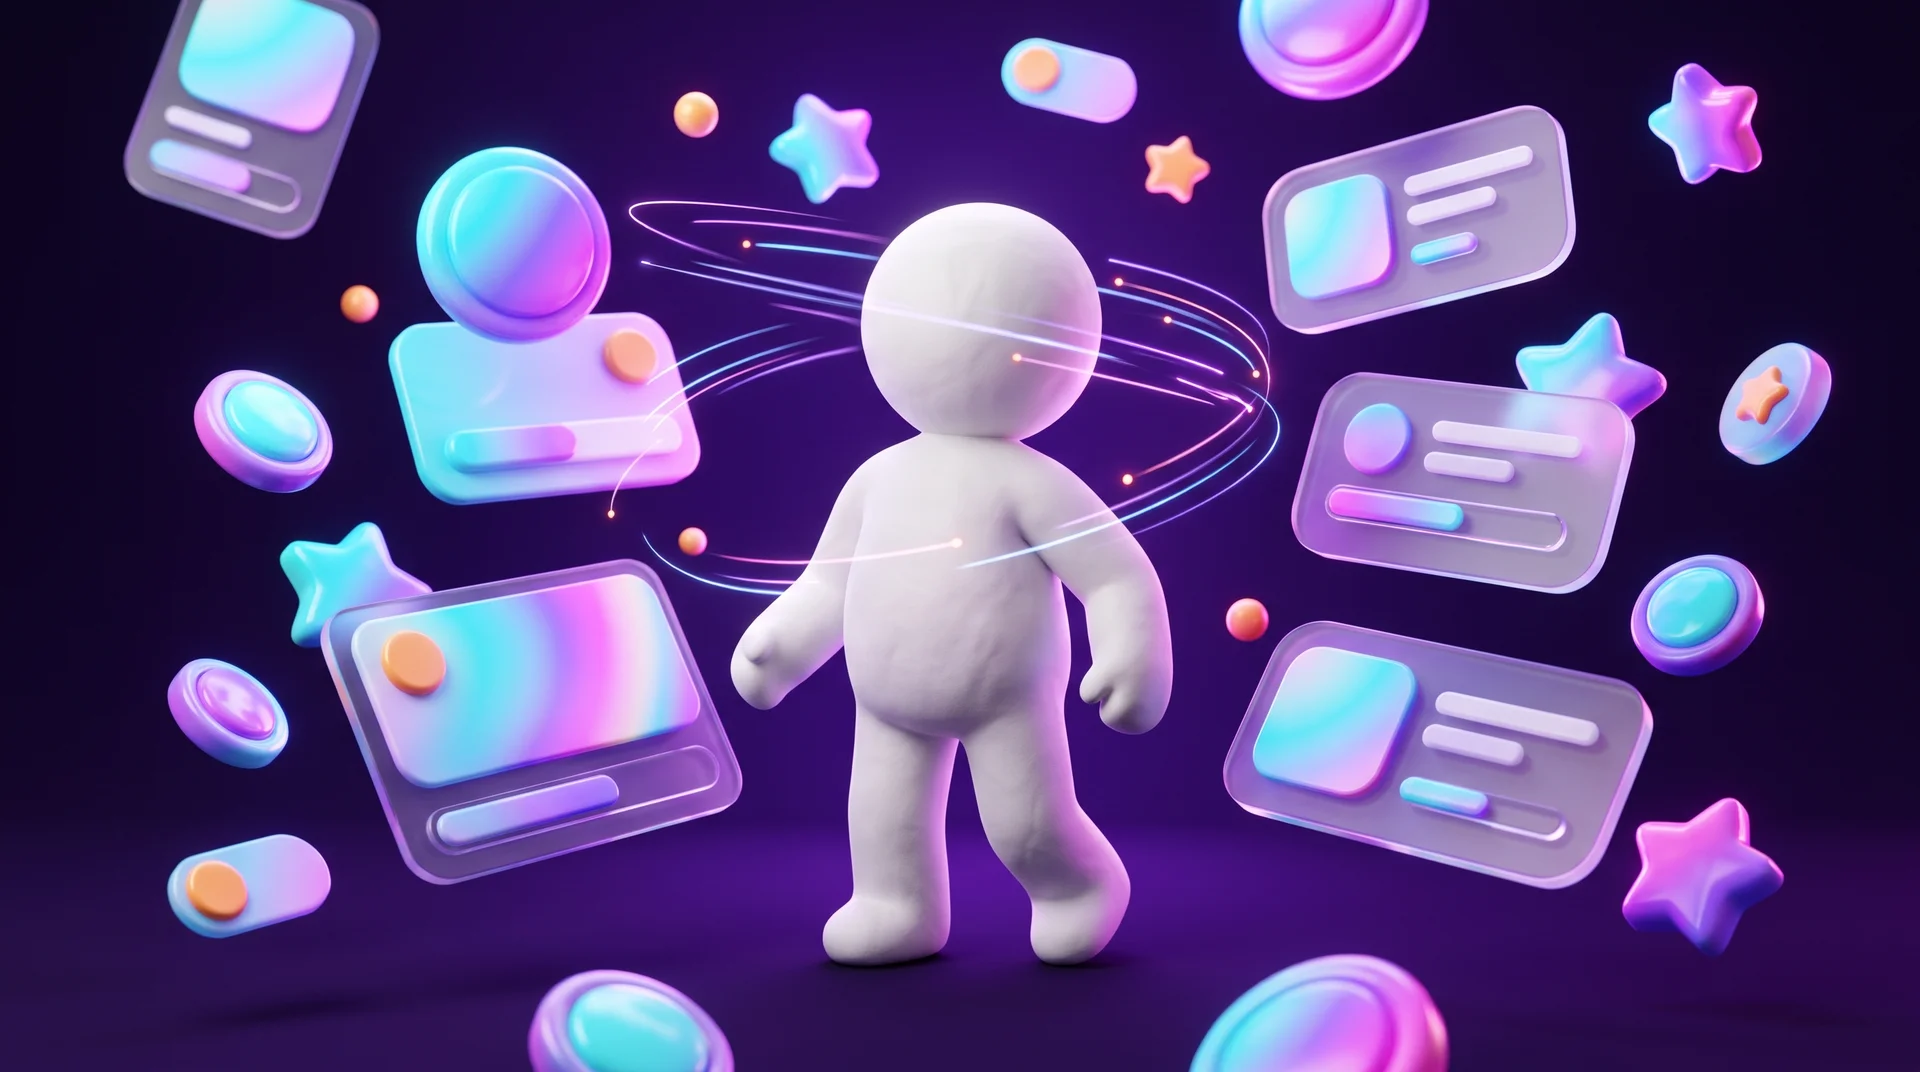
A very common example: a page with product, service or course cards, each with a small "Learn more" button. The designer sees a card with information and a separate button that leads further. The user sees a single object. Their eye focuses on the title, the price and the key details, and they expect any part of the card to be clickable. When clicking the title or the image does nothing, it creates a small moment of frustration, and sometimes the user simply leaves.
The fix is simple: make the entire card a clickable area and keep the button as an extra visual cue. In Webflow, for example, you do this with a Link Block that wraps the whole card.
Banner blindness
Something similar happens with banner blindness. If a block looks like an ad or like something secondary, the brain may ignore it automatically, even when the information inside is genuinely important. A promotion designed as a colourful banner on the side of the page is a perfect candidate for disappearing. We cover the effect and how to deal with it in our guide to banner blindness.
Visual hierarchy as the solution
What all of these cases have in common is hierarchy. Every screen needs one clear primary element, a few secondary ones, and everything else should stay quiet. Size, colour, contrast, spacing and grouping are the tools that tell the brain what matters. We explain the principles behind grouping and proximity in our guide to Gestalt principles in web design.
Cognitive load: why impressive design is sometimes exhausting
A modern interface is not necessarily a comfortable one. In recent years many websites have become visually more complex: huge landing pages, animations, dense screens, elaborate compositions and lots of visual content. All of this works well for a first impression, but it doesn't always help users complete their task faster.
The problem is most obvious when people are looking for information. A user arrives with a specific question, such as how much the service costs or how to get in touch. Instead of an answer, they get a long page full of visual blocks, descriptions and decorative elements. At some point their attention gets tired.
This is called cognitive load: the amount of mental effort needed to understand and use an interface. Every decision, every element that has to be decoded and every item that has to be remembered adds to the load. When it gets too high, people start scrolling fast, jumping between blocks, skipping information and, eventually, giving up.
What helps users feel at ease
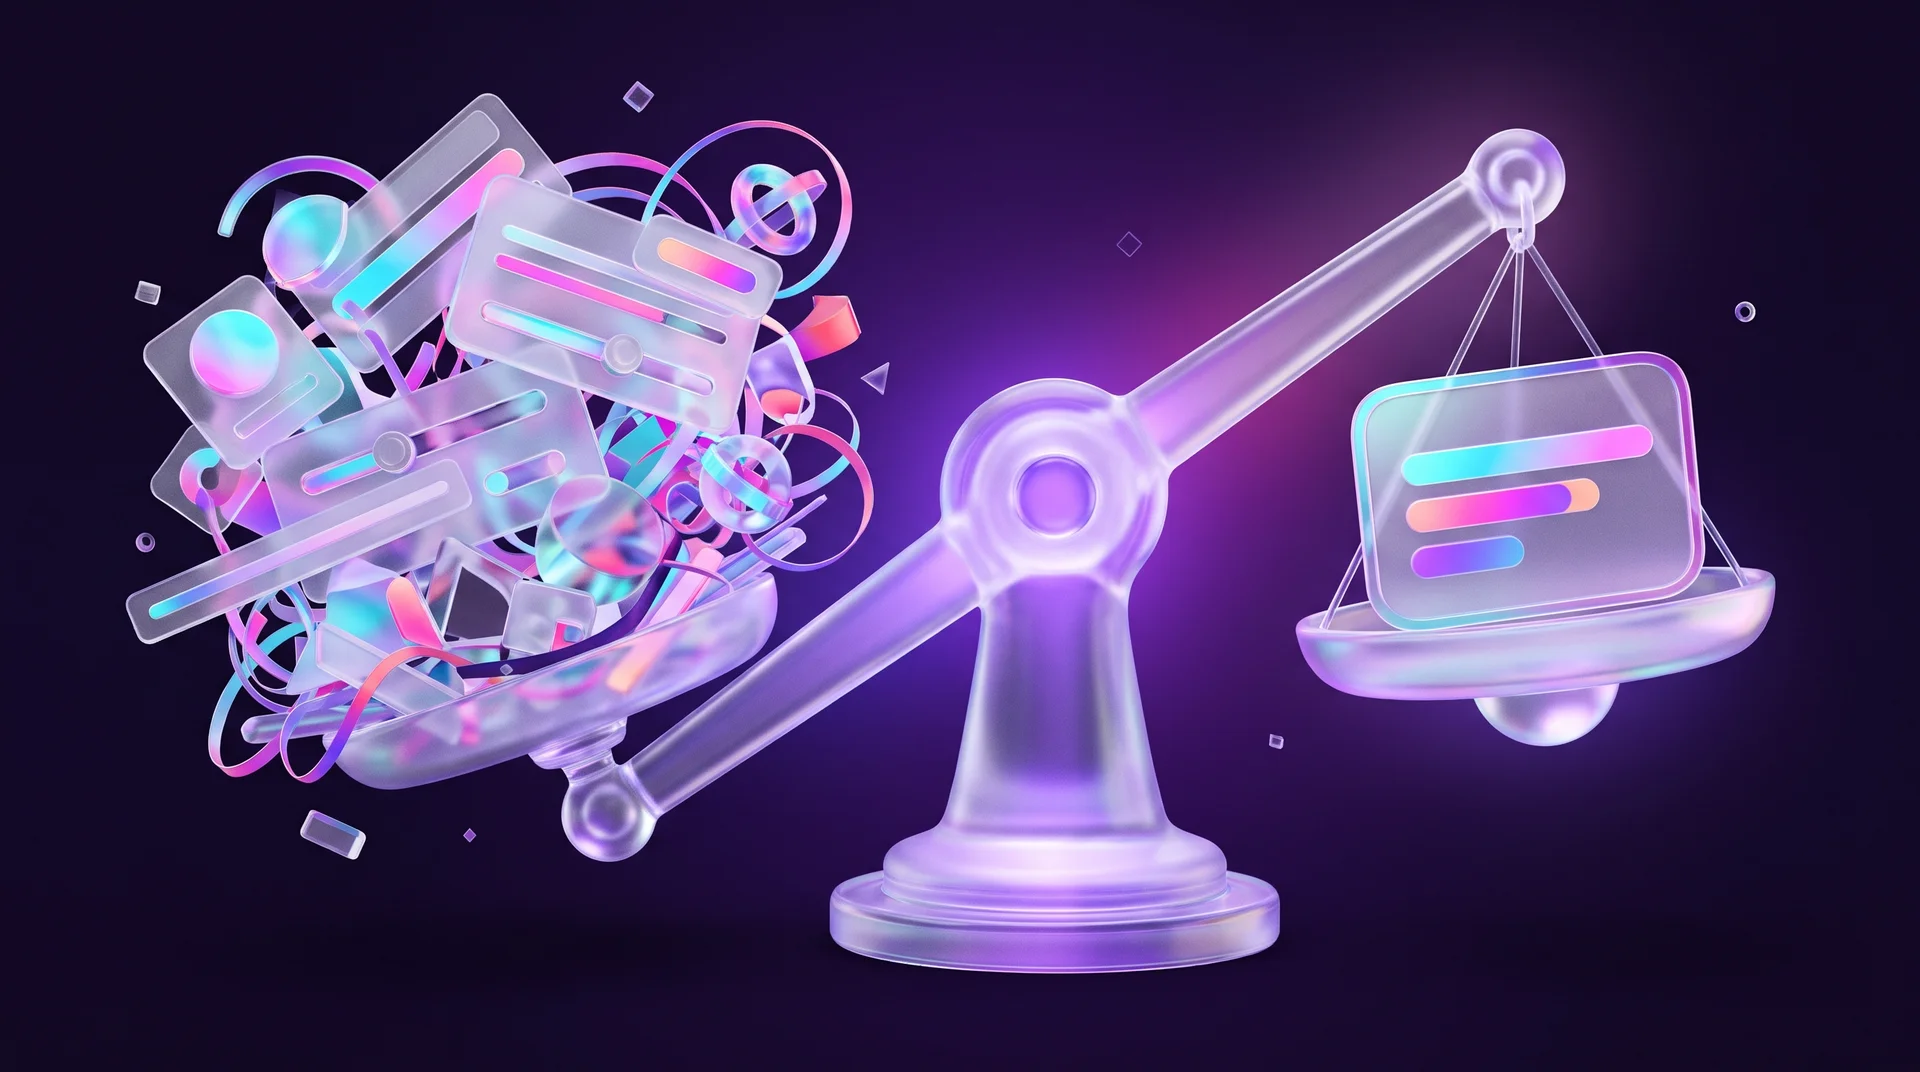
Studies that combine physiological measurements show a consistent pattern: users take in pages with a clear visual structure most calmly. That means well-defined cards, plenty of white space and the key information already on the first screen. When people don't have to hunt for basic facts among dozens of elements, their stress level stays stable.
The opposite is also true: long, continuous text and crowded screens lead to a faster loss of focus. Interestingly, a simpler interface sometimes beats sophisticated visual solutions for exactly this reason: it gives people a sense of control and understanding sooner.
Animation: in the right dose
This is not a recommendation to drop animation. Good animation explains what just happened, guides the eye and gives feedback on an action. The trouble starts when animation becomes the goal in itself: text that appears slowly as you scroll, long transitions that hold back the content, or elements moving in the background that pull the eye away from the information. A good rule of thumb: if an animation makes the user wait, you probably don't need it.
What eye tracking and physiological data reveal
Neurophysiological methods in UX sound futuristic, but in practice they are mainly diagnostic tools. They answer a question that interviews and analytics struggle with: not just what the user did, but how the interface was perceived in terms of attention, effort and emotional response.
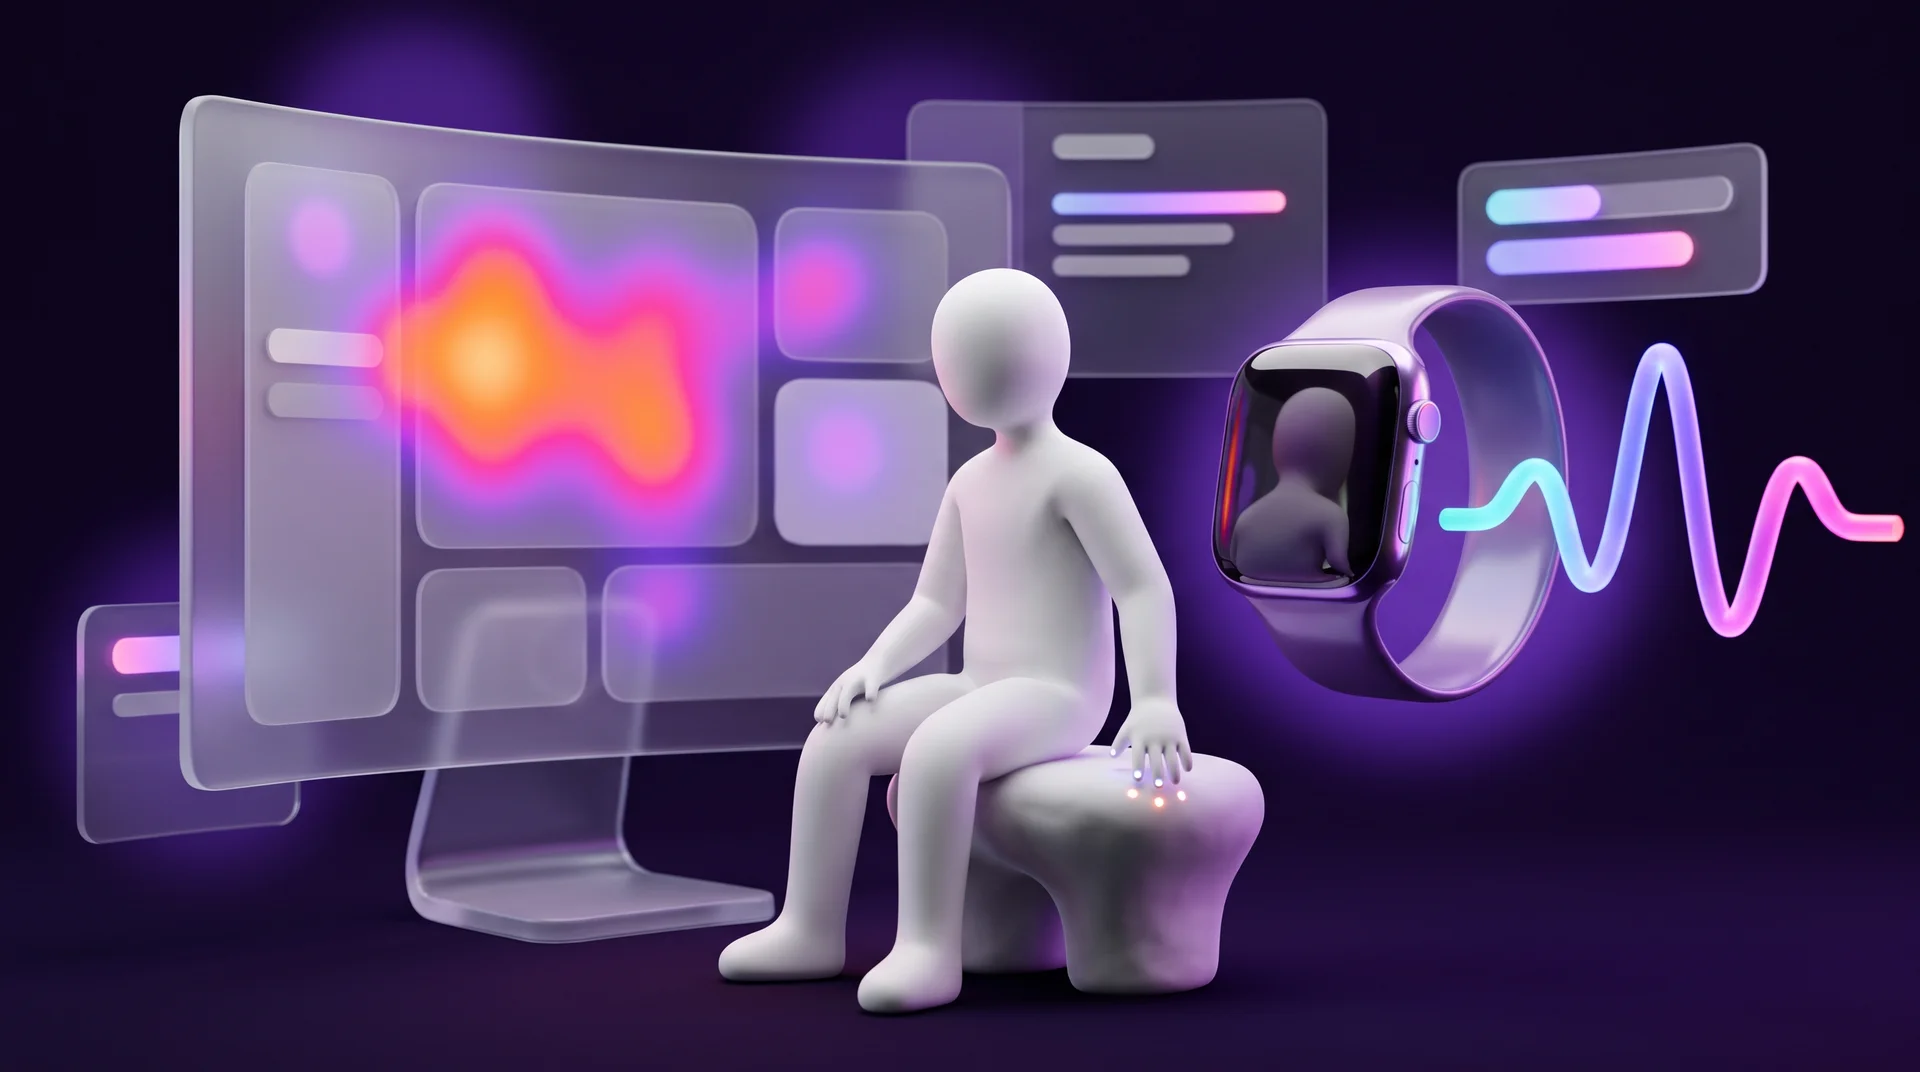
Eye tracking
Eye tracking shows how users distribute their attention across an interface: where they look first, where their gaze stops, what they ignore and how they scan the page. Results are usually presented as heatmaps and gaze plots. They show very clearly how a person takes in a screen in the first few seconds.
Today, eye tracking no longer requires an expensive lab. There are dedicated devices from manufacturers such as Tobii, and there are webcam-based solutions as well. These are less precise, but cheap and fast, and they work well for checking the general direction.
Skin response (GSR / EDA)
Measuring skin conductance, also known as galvanic skin response or electrodermal activity, detects changes in emotional arousal and stress. When something in an interface is confusing, stressful or frustrating, the body reacts, sometimes before the user is even aware of it.
Heart rate (PPG)
Photoplethysmography, the same method smartwatches use to measure your pulse, makes it possible to track how the body responds to stress, engagement and comfort while someone is using an interface.
Why gaze alone isn't enough
A user can complete a task successfully and still experience significant stress or fatigue. That is why eye tracking is often combined with physiological measurements. Their value is highest when the problem is not visible: the user got through the flow without errors, but the data shows that attention became chaotic, searching for elements took longer and simple actions required noticeable effort. Users often can't recognise or put this kind of strain into words, so it won't come up in an interview.
When standard UX testing isn't enough
Classic UX methods such as usability testing, interviews and analytics are very good at showing what users do: where they click, where they make mistakes and at which step they drop off. But they don't always explain why it happens.
An interface can pass standard usability tests: users find the right sections and complete the action. And yet attention and physiological metrics can tell a different story: too much attention goes into searching, users tire quickly, lose their sense of control or experience hidden stress.
Where it matters most
These effects carry particular weight in products where the user experience directly affects conversion, trust and retention:
- e-learning platforms and online courses;
- financial services, insurance and price comparison;
- complex B2B interfaces and management systems;
- online shops, especially at checkout;
- long forms, sign-up and onboarding flows.
A small or mid-sized business doesn't always have the budget for research with physiological equipment, and it doesn't always need it. But it is worth knowing the conclusions of that research and building your website around them from the start. And where a lot of money is at stake, such as a checkout flow or a lead form that feeds a paid campaign, even a focused attention study can pay for itself.
The curse of knowledge: why teams overestimate user attention
The team that built a website has an advantage that real users will never have: they know the interface in advance. The designer understands the page structure, remembers where every element sits and knows where to find the information. The user sees the interface for the first time and takes it in completely differently. In psychology this is called "the curse of knowledge": once you know something, it is very hard to imagine how it looks to someone who doesn't.
This is why so many websites that feel "clean" and intuitive inside the team turn out to be hard to take in for real visitors. It is especially noticeable in long flows. As we saw earlier, once users get the answer to their main question, their desire to keep exploring drops sharply. In other words, a large part of the content never enters their field of attention at all.
How to break the illusion
- Test with outsiders. Five users who don't know the website will uncover more than ten team meetings.
- Watch, don't ask. Recordings of real sessions show how people actually behave, without the theory they construct after the fact.
- Write down the visitor's task. For every page, write one sentence: who arrives, what they want to know and what the next step is. Anything that doesn't serve that sentence is a candidate for removal.
The key takeaway: a good interface is not one that "contains all the information". It is one where people don't have to spend energy figuring out the obvious.
How to build a website that's easy to take in: a practical checklist
Here is a list you can work through before a launch or a redesign. It turns what attention research teaches us into concrete steps.
Structure and content
1. Answer the main question on the first screen. What you offer, who it is for and what the next step is. No scrolling required.
2. Headings that actually say something. A subheading should work for someone who reads nothing else. "Pricing and plans" beats "Our solution".
3. Short paragraphs with a strong first sentence. The first sentence of every paragraph should carry the idea, because it is often the only one that gets read.
4. Numbers and facts instead of descriptions. A price, a delivery time, opening hours or years of experience are absorbed faster than a paragraph about "professional, high-quality service".
5. Lists instead of walls of text. When you have three or more benefits, present them as a list or as cards.
Hierarchy and interaction
1. One primary action per screen. One prominent button; everything else is secondary.
2. Fully clickable cards. If something looks like one object, it should behave like one object.
3. Promotions that don't look like ads. Design important information as part of the content, not as a banner on the side.
4. White space as part of the design. Spacing isn't wasted space; it is what separates one idea from another.
5. Animation that serves the content. Never make the user wait for it.
Mobile, languages and accessibility
1. Start with mobile. For most businesses a large share of traffic comes from phones, where the first screen is especially small. Whatever doesn't fit there, many people will never see.
2. Proper localisation. If you serve several markets or languages, each version should read naturally and keep the same clear hierarchy, with a visible language switcher, local formats for dates, prices and phone numbers, and forms that behave the way people in that market expect.
3. Short forms. Every extra field adds load. A name and an email or phone number are often enough to start a conversation, and you can add a WhatsApp button as a low-effort alternative.
4. Accessibility. Good contrast, a readable font size and a correct heading structure help everyone, not only people with disabilities. In the EU, the European Accessibility Act now covers many digital products and services, and WCAG is the usual technical reference. This is general guidance, not legal advice. We go into more detail in our website accessibility guide.
Tools for testing attention without a lab
You don't need physiological equipment to understand how visitors take in your website. The tools below give you a good picture, and some of them are free.
Heatmaps and session recordings
- Microsoft Clarity. A free Microsoft tool with click and scroll heatmaps, session recordings and detection of "rage clicks" and "dead clicks" on elements that aren't clickable. It is particularly useful for checking whether people click on cards that don't respond.
- Hotjar. Heatmaps, recordings and short on-site surveys, with a free plan and paid tiers.
A scroll map answers a simple but important question: how far down the page people actually get. If your form sits below the point where most visitors have already left, it is obvious what needs to change.
If you install these tools on a site with visitors in the EU, remember that session recordings and analytics usually require consent under GDPR and the ePrivacy rules. Set up your cookie banner and mask sensitive fields before you start recording. Again, this is general guidance, not legal advice.
Analytics
Google Analytics 4 shows which pages people leave from, how long they stay engaged and where they abandon a flow. It doesn't explain why, but it shows you where to look first. Combining analytics with session recordings is usually the first and cheapest step.
Remote usability testing
Tools like Maze and UserTesting let you give users tasks on a prototype or a live website and record their screen and voice while they complete them. Even a test with five people from your audience, over a video call with screen sharing, will expose most of the obvious problems.
AI attention prediction
There are also tools that use models trained on eye-tracking data to predict where people will look in a design before it goes live. They don't replace testing with real people, but they can give you a quick indication while you are still designing in Figma.
A test you can run today
Open your homepage on your phone, look at it for five seconds and close it. Now try to answer: what does the business offer, who is it for, and what should you do next? If you struggle to answer, and it's your own website, a new visitor will struggle even more. You'll find more principles for a self-review in our guide to Nielsen's ten usability heuristics.
How RJL Studio builds websites that are easy to take in
At RJL Studio we plan websites around what visitors are looking for, not only around how the page will look. Before design starts, we map the audience's main questions, decide what must appear on the first screen and build a clear hierarchy: one primary action, headings that work even at a quick scan, and cards that behave the way people expect.
After launch, we connect tools such as Microsoft Clarity and Google Analytics 4, check where visitors get stuck and improve the site based on data rather than gut feeling. That is how we work on UX/UI design projects and on websites built in Webflow.
If your website looks good but doesn't bring in enquiries, or you are planning a new one and want it to work from day one, get in touch and we'll look together at where your visitors' attention gets lost.
Frequently asked questions
Do visitors really not read website copy?
Most of them scan rather than read. They pick up headings, numbers, lists and the first sentence of each paragraph, then move on once they've found the answer to their question. Long-form text still matters for readers who want to go deeper and for search visibility, but it should be structured so that someone who only scans still gets the main point.
What is cognitive load on a website?
Cognitive load is the amount of mental effort it takes to understand and use a website. Lots of elements competing for attention, continuous blocks of text, long forms and animations that hold back the content all increase it. When the load is high, people skip information and leave sooner.
What is eye tracking in UX, and does a small business need it?
Eye tracking measures where users look, for how long and in what order, and presents the results as heatmaps and gaze plots. Most small businesses don't need a full lab study. Click and scroll heatmaps, session recordings and usability tests with a handful of users give a good enough picture in most cases.
How can I tell if users are missing my main button?
Check a click heatmap to see how many people click it and where they click instead, and a scroll map to see how many visitors even reach it. Session recordings show whether people are searching for it or clicking on other elements that look clickable. If the button doesn't stand out from its surroundings, or there are several equally prominent buttons next to it, it is probably getting lost.
What should I improve first on an existing website?
The first screen on mobile. Make sure that within a few seconds it is clear what you offer, who it is for and what the next step is, and that there is one prominent call to action. Then install a tool like Microsoft Clarity, watch a few dozen recordings and see where visitors get stuck. That usually reveals the improvements with the biggest impact.
Disclaimer: blog content is for general information and learning only and is accurate as of its publication date. It is not professional, legal, financial or business advice, nor a recommendation or call to take any action. Any use of this information is at the reader's own risk, and we accept no liability for any resulting loss. Links to external websites and tools are provided for convenience only. We recommend consulting a qualified professional before making decisions.