

End-to-End Analytics: How to Know What Really Brings in Customers
The ads are running, leads are coming in and sales are moving. But which channel actually brought in the money? End-to-end analytics answers exactly that question.
Imagine you've opened an online store selling T-shirts for TV series fans. You have stock, a list of popular shows and a few big Facebook fan groups. You buy sponsored posts in ten of those groups and run short Reels of cats in T-shirts from different shows dancing under neon lights.
From here, there are three possible scenarios:
- The campaign was a hit and all the stock sold out. You're marketing geniuses and already planning a conference talk. End-to-end analytics would be nice, but it isn't urgent.
- The campaign flopped. Nobody got excited, a lawyer's letter arrived about using images from the shows, and fans wrote that it was the worst cotton they'd ever seen. The business shuts down.
- The most likely scenario. You sold a shirt or two for every show you advertised, plus six shirts for shows that never appeared in any ad. Someone emailed to ask whether you also sell leggings, and one company asked for mugs with a picture of Paris for the office's birthday. You're trying to figure out what's going on. Did the advertising work at all? And Paris: a chance to expand the collection, or just your imagination?
You search Google for answers, and everywhere you see the same advice: you need end-to-end analytics.
In this guide we cover:
- what end-to-end analytics is and how it works;
- which data businesses connect and why;
- how to get started: a basic setup in 5 steps;
- how to use the data for sales: ABC and RFM analysis;
- who should build the system and which mistakes to avoid.
What end-to-end analytics is and why you need it
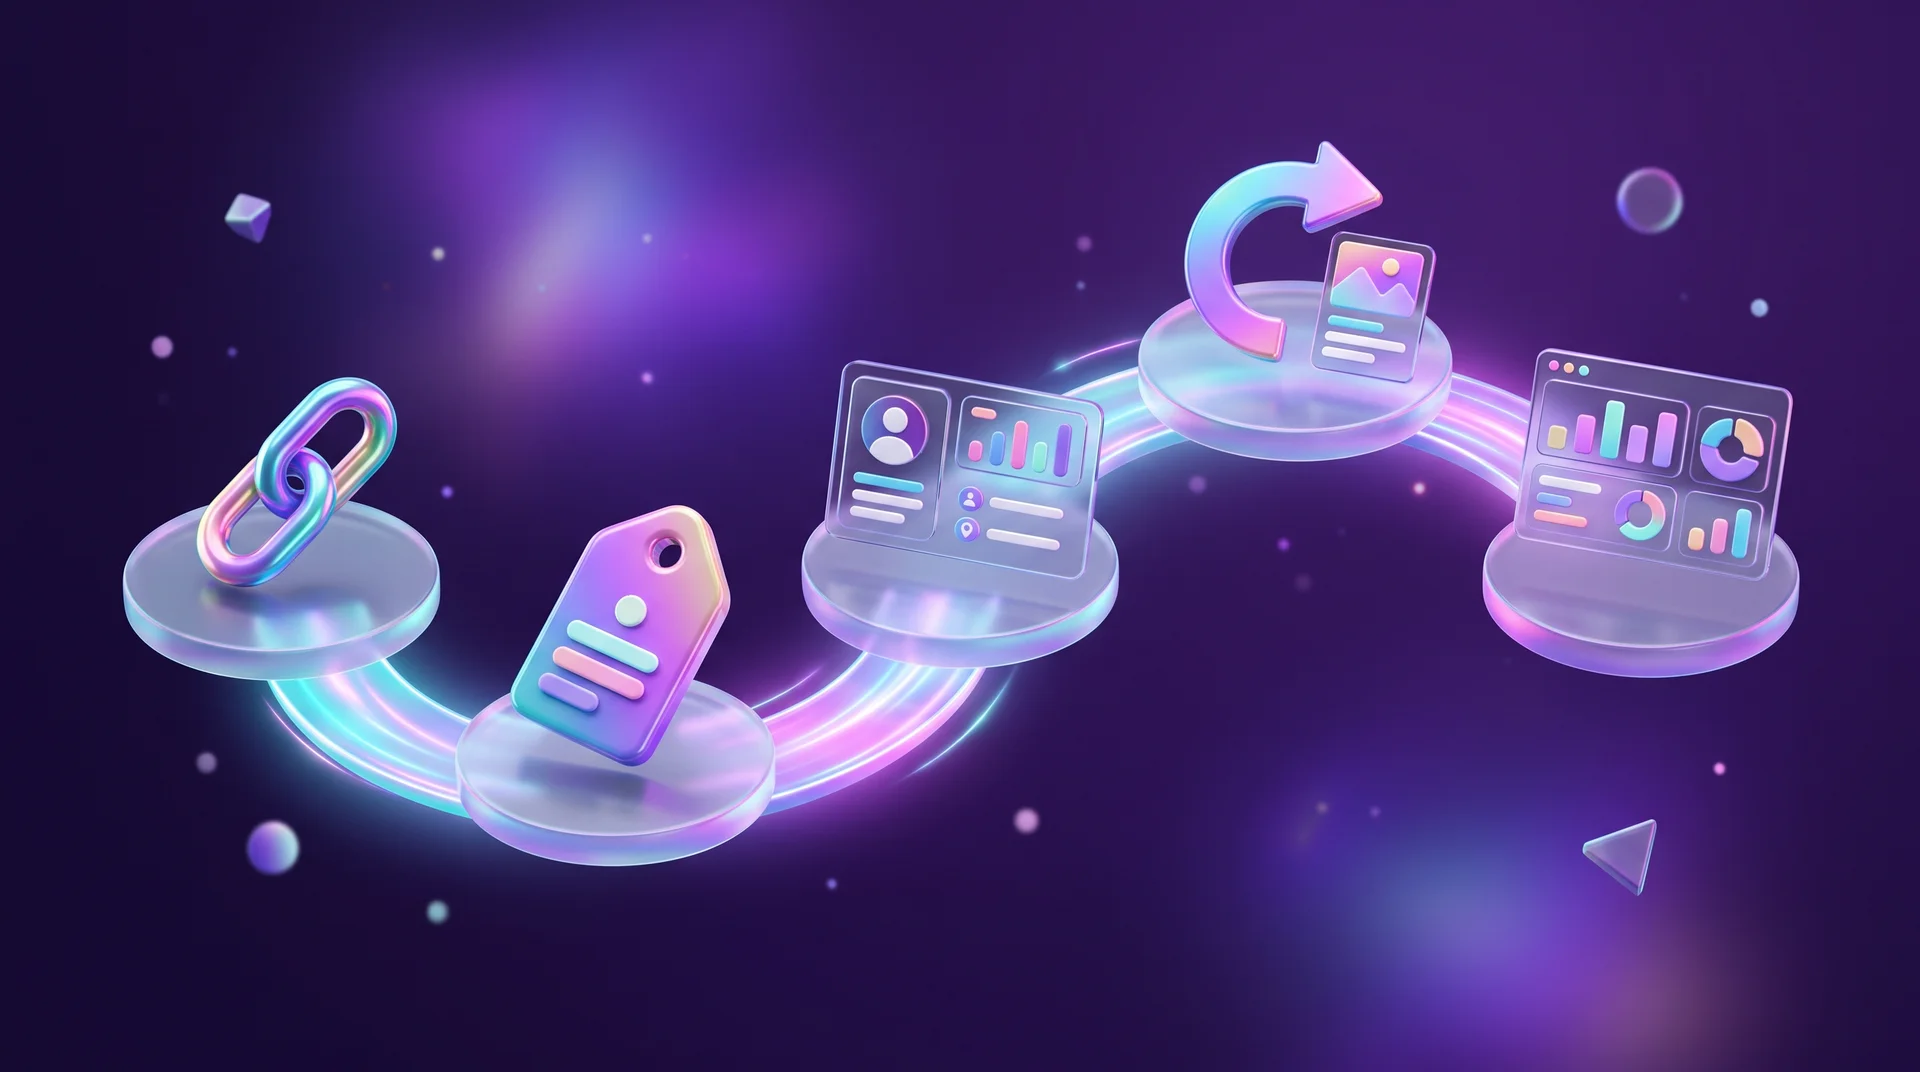
A business needs end-to-end analytics at any stage, the moment decision-making turns into guesswork. End-to-end analytics is a way of connecting several data systems into one picture: from the click on the ad, through the inquiry and the deal, all the way to the money landing in the account. It isn't always complicated.
The simplest example is an online purchase. The customer pays, their bank approves the transaction, the money goes to the seller's account, the system generates an invoice and sends it to the customer, and the order details (number, contact details and address) are saved in the order management system.
The principle is that several participants are connected to a system where certain information is recorded. When an event happens, such as a purchase, it triggers a chain of actions that updates all the participants.
Important to understand: end-to-end analytics is a way of working, not software you buy off the shelf. It's a process that can connect any system at all.
We run into it in everyday life too. A smartwatch sends the calories you burned on a run to your phone, and the app suggests drinking more water. You send yourself a WhatsApp message to open a file on your computer. You log into your account at an online store with your phone number and see all your past orders. In all these cases, different systems are connected and pass data to one another.

What data businesses connect
In marketing, end-to-end analytics usually means connecting ad spend to several data sources:
- website revenue;
- revenue from the physical store;
- phone calls and forms submitted on the website;
- WhatsApp and chat inquiries;
- lead handling and deal status in the CRM;
- stock availability and shipping status;
- email campaigns and automated customer communication;
- loyalty program, points and coupons;
- a single database that brings all of this together and syncs with accounting.
Which data a business collects and connects usually depends on its size:
- A micro business usually gets by with connecting revenue, expenses, calls and inquiries.
- A small business also wants to connect inventory and shipping.
- A mid-sized or large company needs automation, personalized communication, a loyalty program and in-depth customer data analysis.

What to do with the data
A breakdown of marketing activity
This is the first need of micro and small businesses: connect revenue and expenses in one system and see how many customers each ad brought in. The market has largely solved this already, and there are ready-made solutions for it.
Google Analytics 4 is free, connects to Google Ads in a few clicks and shows conversions by traffic source. To also see Meta campaigns, email campaigns and organic posts, add UTM parameters to every link. You can bring spend from all platforms into a single Looker Studio dashboard using built-in connectors or tools like Supermetrics.
If you sell concert tickets, subscriptions or products paid for instantly on the website, that's probably all you need, and for a long time.
What happened to the lead after the inquiry
This information is essential for businesses with a long sales cycle: cash on delivery, dental treatments, cars, real estate and B2B products and services. Here it's not enough to know how many forms were filled in. You need to see what happened to each inquiry: whether a deal closed, for how much and when the money actually came in.
In practice it works like this: store the lead's traffic source, UTM parameters and Google Click ID (GCLID) in the CRM along with the lead. When the deal closes, send that data back to the ad platforms: to Google Ads via offline conversion import, and to Meta via the Conversions API. That way the algorithm learns to bring in customers who buy, not just people who fill in forms.
Some CRMs, like HubSpot, have built-in connections to the ad platforms. With others, like monday.com, you connect the data with Make, Zapier or n8n, which takes a bit of setup work.
There are much more complex tasks too. For example, figuring out whether a website order came from a returning customer, how many points to give them, when they last bought and what their favorite category is, so you can offer them a bigger discount on it. There's no off-the-shelf solution for tasks like these, whatever the vendor's website says. It's a development project.
Business monitoring in mid-sized and large companies
Large companies usually have a budget for sophisticated tools, but lack people to make sure the data flows correctly. And more importantly, they lack marketers who will actually use all the capabilities. A system like this can't be built without developers, a data architect and analysts.
End-to-end analytics helps you understand customers, plan promotions, measure results and build a growth strategy. But all of that stays on paper if it isn't connected to a control system.
Connecting to accounting
At every stage of a business's life, accounting has to evolve along with the new capabilities. If you spend money on advertising, you need to decide up front:
- how to record spend for each marketing activity;
- where to record the revenue from those activities;
- how to handle points, coupons and order cancellations;
- how to account for free shipping;
- how to combine SKUs for promotions and discounted bundles.
The goal isn't to use all these tools to build a parallel set of books with wrong numbers. Marketing analytics numbers and accounting numbers may never match. A business that manages to bridge that gap is one that's truly run on data.
Only technical people can connect accounting to the ad platforms, databases, loyalty program and inventory system. So if a manager asks why you're advertising a product that's out of stock, the answer is usually not "marketing dropped the ball" but "the systems aren't connected".
How to get started: a basic setup in 5 steps
Before you set anything up, assess the size of the business. A big investment in automation doesn't always pay off at small volumes. And most businesses that want to improve ad profitability first need to fix mistakes in their existing setup: broken tags, campaigns without UTMs or conversions counted twice. Building a smart system is always more fun than hunting for bugs in your ad accounts, but that's where it starts.
These are the five steps of a basic setup:
- Step 1: UTM discipline. Every link in a campaign, email and sponsored post gets UTM parameters with a fixed structure: source, medium and campaign name.
- Step 2: Key events in GA4. Define the actions that matter to the business: form submission, WhatsApp click, phone call and purchase. It's convenient to manage all tags through Google Tag Manager.
- Step 3: Traffic source saved in the CRM. Add hidden fields to your forms that capture the UTM and GCLID, so every lead in the system has a source.
- Step 4: Sales go back to the ad platforms. When a deal closes, send it to Google Ads and Meta as a conversion, along with the amount.
- Step 5: One dashboard. Bring spend, leads, deals and revenue together in Looker Studio, and calculate customer acquisition cost and return on ad spend (ROAS) for each channel.
After these steps you can already answer the opening question: which ads brought in the money, not just the clicks. The landing page plays a part too: if it's built right, as we explained in our guide to landing page design, every action on it is easy to measure.
Analytics and sales: ABC analysis and RFM segmentation
Let's say the system is already up and running. At first it mainly helps with two things: understanding your product range and segmenting customers so you can make them personalized offers.
ABC analysis of your product range
When you redesign a website, you have to decide what goes at the top of the page and what goes at the bottom, what to feature on the home page and what to leave out. These dilemmas exist because screen space is limited, users can't remember everything, and the design needs to stay clean.
This is where ABC analysis helps: it lets you quickly prioritize almost anything. It's used mainly in merchandising and product range management. It shows which products are bestsellers, which generate steady demand and which bring in almost no money but are still on display.
The principle is simple. You split products into three groups:
- Group A. About 20% of products that generated about 80% of revenue in the period analyzed.
- Group B. About 30% of products that generated about 15% of revenue.
- Group C. The remaining 50% or so, which generated about 5% of revenue.
It's a mistake to think Group C only holds products nobody needs. It includes products that create a sense of choice, products you must keep in stock regardless of demand, and premium products. They're bought rarely, but they keep customers loyal for years.
ABC analysis helps you:
- understand which of the business's strengths to highlight to everyone;
- decide which information to show only in special cases;
- evaluate other things too, such as campaigns.
You can segment campaigns the same way: by the revenue they brought in and by the budget they consume. A campaign in Group C for revenue and Group A for spend is the first candidate for review. This kind of segmentation opens up plenty of budget optimization options and helps you build bundles and promotions.

Customer segmentation with RFM
A loyalty program helps you thank customers for choosing you and gives them reasons to come back more often. It's especially helpful in two opposite situations: when you want to treat a customer, and when you need to apologize to them.
Treating customers isn't simple: the gesture has to be right, personal, justified and measured, neither too rare nor too frequent. An apology is a tricky gesture too. It shouldn't look like dodging the problem, and a gift shouldn't look like a bribe. And in most cases the customer won't tell you directly that something went wrong. You have to figure it out yourself.
That's what the RFM customer segmentation method is for:
- R (Recency) – how much time has passed since the last purchase;
- F (Frequency) – how often the customer buys;
- M (Monetary) – how much money they've spent.
Every customer in the database gets a score from 1 to 4 on each metric:
- For Recency, 1 is a customer who bought a long time ago and 4 is one who bought recently.
- For Frequency, 1 is a customer who bought once or twice and 4 is one who buys a lot.
- For Monetary, 1 is a customer who spent little and 4 is one who spent the most.
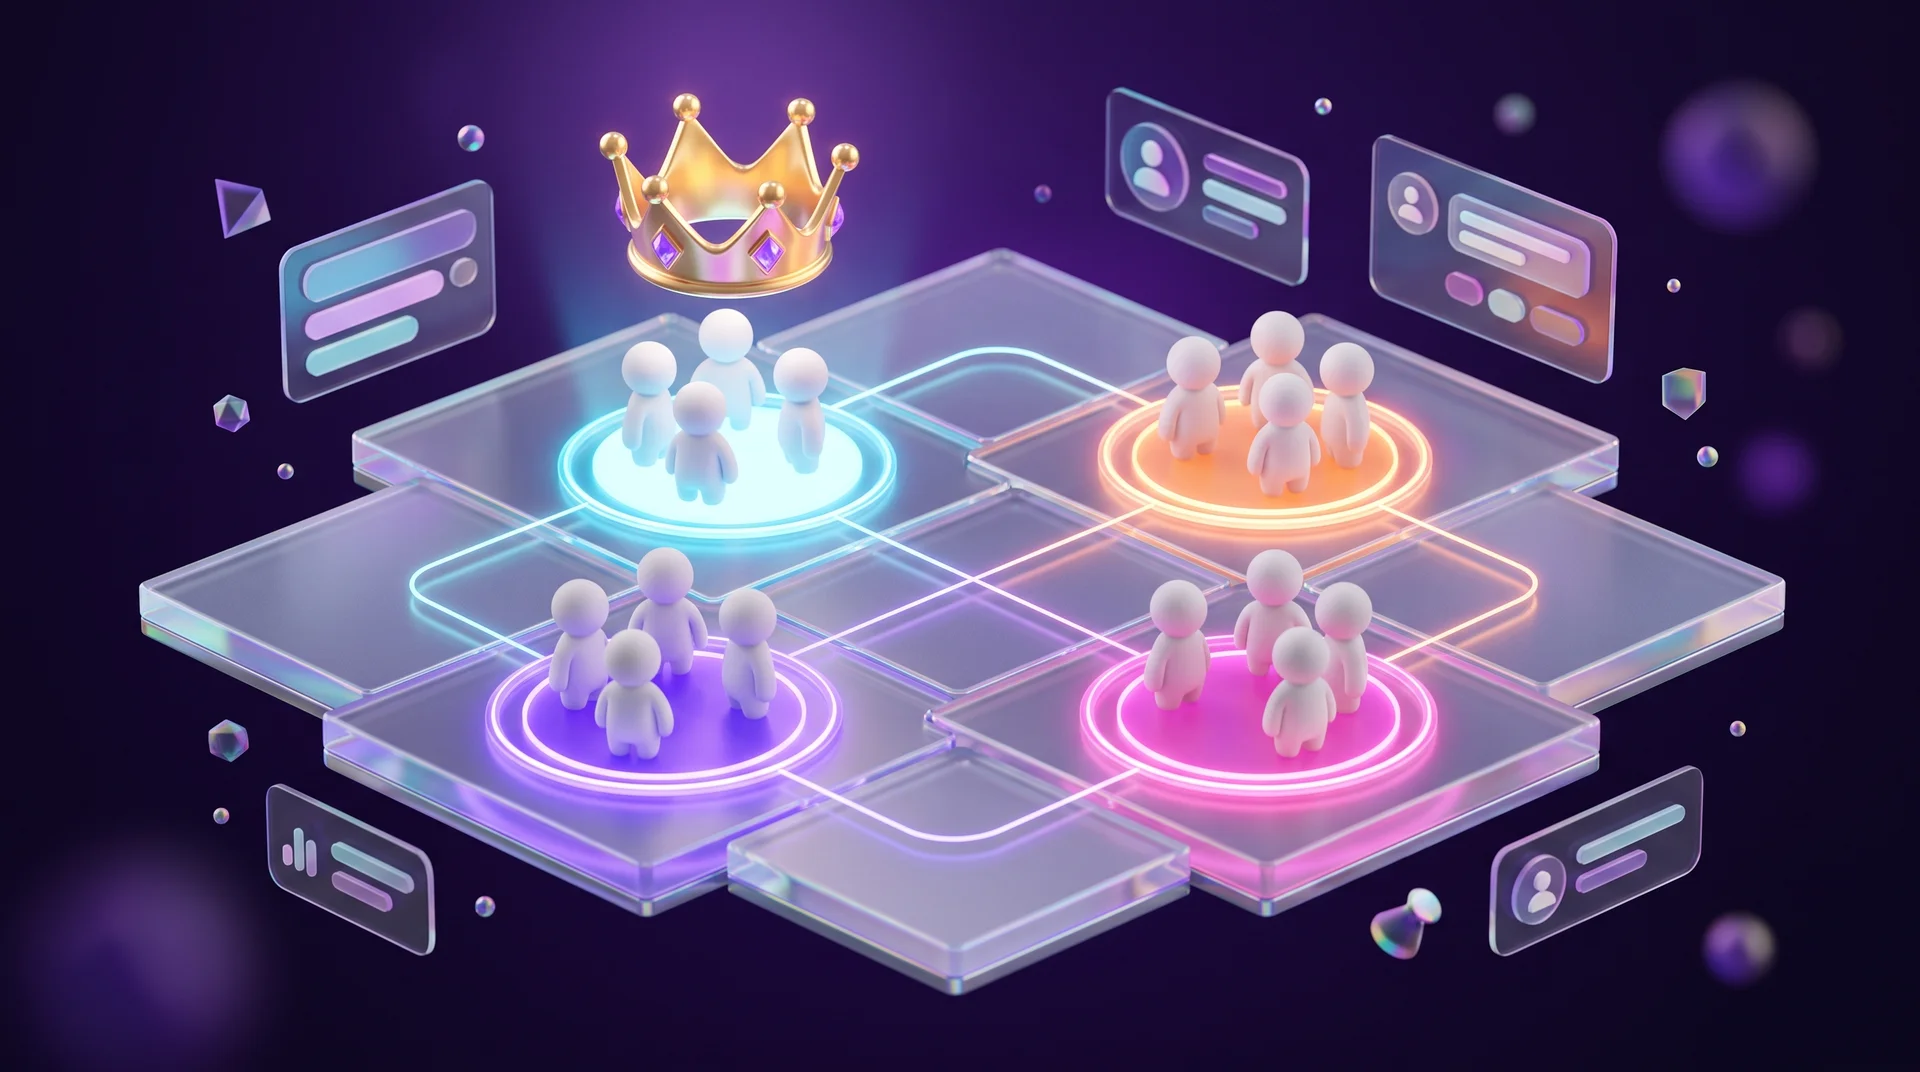
The three scores form a code that defines the customer's segment. For example, 444 are the "champions": they buy a lot, bought recently and spent a large amount. Other common segments:
- loyal customers;
- potential loyalists;
- recent customers;
- customers who need a reminder that we exist;
- at-risk customers we might lose;
- customers who have churned and don't respond.
If you run the analysis monthly or quarterly and track the changes, you discover interesting things. For example, customers who bought a lot and suddenly stopped, new customers who spent a large amount, or customers who buy often but only small amounts at big discounts.
You can build a separate communication strategy for each segment and grow revenue that way. Some customers, for instance, don't need to receive promotional messages at all. AI tools can help analyze the segments and craft the right message for each one, as we explained in our guide to AI marketing strategy.
Who should set up end-to-end analytics
To set up end-to-end analytics in a business, you need an analyst. They can do almost everything, except connecting the loyalty program.
A marketer alone won't build a system like this. They can set up UTMs, GA4 events and a basic dashboard. Connecting the systems takes an analyst with development skills, and large companies hire a developer and an analyst separately. It isn't cheap, so small and mid-sized businesses usually work with an external studio or integrator that sets up the connections, and leave day-to-day analysis to the marketing team.
Common mistakes
- A complex system before the basics work. An impressive dashboard won't help if half the campaigns have no UTMs and conversions are counted twice.
- Counting leads instead of sales. A campaign that brings in lots of cheap form fills can lose money if none of them become customers.
- A CRM without traffic sources. If a lead enters the system without a source, there's no way to know which channel brought in the deal.
- Numbers that don't reconcile with accounting. If marketing and finance count revenue in two different ways, decisions will be based on the wrong numbers.
How RJL Studio helps connect your data
At RJL Studio we set up the connections that turn scattered data into a single picture: website forms that pass the traffic source to the CRM, events in GA4 and Google Tag Manager, deals sent back to Google Ads and Meta, and Looker Studio dashboards. We build the connections between systems in n8n, Make and Zapier.
Want to know which ads really bring you customers? Read about our automation and integration services or campaign management, or get in touch and we'll get back to you.
FAQ about end-to-end analytics
What's the difference between Google Analytics and end-to-end analytics?
Google Analytics shows what happens on the website: where visitors came from and what they did. End-to-end analytics also connects that to what happened after the website: calls, deals in the CRM, payments and accounting.
Does a small business need end-to-end analytics?
Yes, but a simple version. Usually tidy UTMs, GA4 events, a traffic source saved in the CRM and one dashboard are enough. Complex systems suit businesses with many deals and a long sales cycle.
What tools do I need to get started?
Google Analytics 4 and Google Tag Manager for measurement, a CRM to manage leads and deals, and Looker Studio for the dashboard. To connect the systems, use Make, Zapier or n8n, or the CRM's built-in connectors.
Why don't the numbers in Google Analytics match the CRM?
There are several reasons: visitors who block cookies or don't consent to tracking, customers who switch between devices, phone inquiries that aren't measured on the website, and different conversion attribution models. Some gap is normal, but a large gap usually points to a setup problem.
How long does it take to set up the system?
A basic setup of UTMs, events, traffic source in the CRM and a dashboard usually takes anywhere from a few days to a few weeks. A full system with a loyalty program, inventory and accounting is a project of several months.
Disclaimer: blog content is for general information and learning only and is accurate as of its publication date. It is not professional, legal, financial or business advice, nor a recommendation or call to take any action. Any use of this information is at the reader's own risk, and we accept no liability for any resulting loss. Links to external websites and tools are provided for convenience only. We recommend consulting a qualified professional before making decisions.