


Business Dashboards: What They Are and How to Build One
Big decisions, such as raising the ad budget, hiring another salesperson or pausing a campaign, need a lot of data at once. A dashboard lets you see that data quickly: instead of opening ten reports in ten different systems, you look at one screen and understand what is happening in your business.
Most small and mid-sized companies run several systems side by side: a website, Google Analytics, Google and Meta ads, a CRM, an invoicing tool and often an online shop. Each system shows its own numbers in its own way, and none of them gives you the full picture. A good dashboard connects all of these sources and shows only what matters.
In this guide we cover:
- what a dashboard is and why businesses need one;
- how a dashboard works under the hood;
- which types of dashboards exist;
- who builds dashboards and what the process looks like;
- how to build a dashboard yourself, step by step;
- which tools fit which situation, and which mistakes to avoid.
What a dashboard is and why you need one
A dashboard is an information panel that pulls data from other systems and presents it clearly: headline numbers, charts, graphs, short tables and colour-coded indicators. The data refreshes automatically, either on a fixed schedule or in real time.
The word comes from the car: the dashboard is the panel of gauges in front of the driver. In fact, we use dashboards every day without thinking about it:
- the car dashboard shows speed, fuel level and warning lights;
- the display in a lift shows the floor, the direction of travel and the load;
- a smartwatch shows the time, your steps and your heart rate.
Each of them exists to help you make a decision. You see that the fuel is running low, so you stop at the next station. You see there are thirty minutes left before a meeting, so you book a taxi instead of walking.
A business works the same way. For many years decisions were made using what is jokingly called the HiPPO approach, the Highest Paid Person's Opinion: whoever earns the most decides based on gut feeling. The alternative that grew up next to it is data-driven decision making. To work that way you need to collect data and show it in a form people can actually read. That is how reports appeared first, and dashboards after them.
What a dashboard gives your business in practice
- Time savings. Instead of assembling a spreadsheet report every week, the numbers update on their own.
- A shared language. When the whole team looks at the same figures, there are fewer arguments about "what really happened this month".
- Faster reactions. If leads drop sharply on a Tuesday, you see it on Tuesday, not at the end of the month.
- Focus. A dashboard forces you to decide which metrics really matter, and that decision alone is valuable.

Dashboard, report and infographic: what is the difference
An infographic is a finished image with data. You cannot change it, you can only look at it. A report is usually a detailed table prepared for a specific period. A dashboard updates by itself, shows only the essentials and lets you drill down: you click a number and reach the detailed report behind it. If you want to pick the right chart for every type of data, read our guide to chart types and data visualisation.
How a dashboard works under the hood
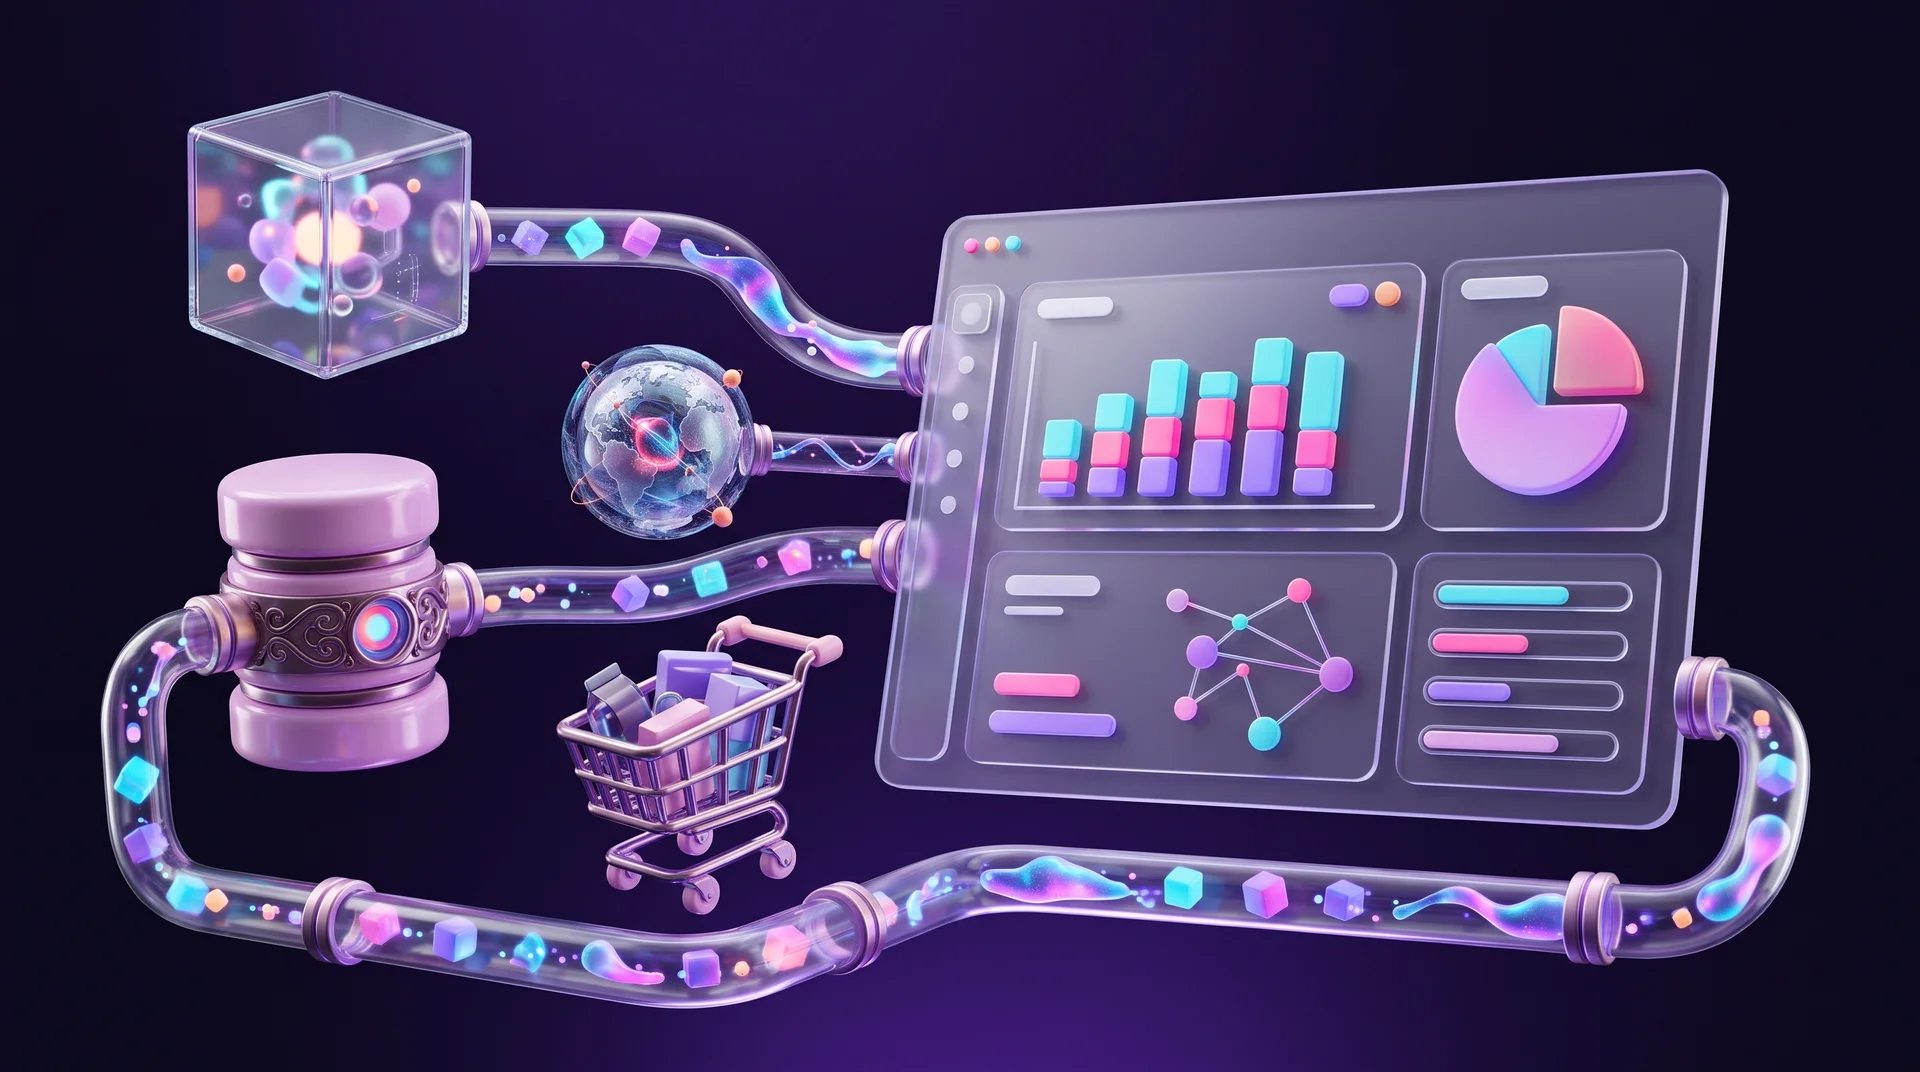
The simplest example is the car again: the driver turns on the headlights, a sensor detects it and a green light comes on in the instrument panel. In a business the chain is longer, but the logic is the same. Most scenarios look like this:
1. Something happens. A visitor fills in a form on your website, a deal closes in the CRM, an order arrives in the shop or an ad gets a click.
2. The event is recorded. The system where it happened stores it: Google Analytics 4 logs the website event, the CRM saves the lead, the payment provider records the transaction.
3. The data moves into a storage layer. For a small business this can be a Google Sheets spreadsheet that fills itself automatically. For a larger one it is a data warehouse such as BigQuery, where data from every system flows together.
4. The dashboard refreshes. The visualisation tool pulls the data, calculates the metrics and displays them.
You can build step three without heavy development, using automation tools such as n8n, Make or Zapier, or the ready-made connectors that BI tools provide. We covered how to bring data from every channel into one picture in our guide to end-to-end marketing analytics.
Alerts and highlights
A good dashboard does more than display numbers. It draws your eye to whatever needs attention. If a metric falls below a threshold you set in advance, its area turns red. For example, cost per lead has risen 40% compared with last week, or the conversion rate on a landing page has dropped. Anyone looking at the screen sees at once that something is wrong and can decide what to do or ask the owner of that metric for details.
Many tools can also send an alert by email, Slack or WhatsApp when a metric crosses a threshold, so nobody has to stare at the dashboard all day.
Types of business dashboards
No single dashboard suits everyone. They are usually split into three types according to their purpose.
Strategic dashboard
Built for management and business owners. It shows a small number of high-level metrics: revenue, profitability, growth and progress towards targets. It refreshes once a day or once a week, and people look at it to understand direction rather than to manage daily work. If you set quarterly goals, it pairs well with the OKR goal-setting method.
Operational dashboard
Built for teams who work with the data every day: sales, customer support, logistics. It shows what is happening right now: new leads, open tickets, orders waiting to be shipped. It refreshes in real time or close to it.
Analytical dashboard
Built for analysts and marketing managers. It lets you dig into the data: filter by channel, period, audience or product, compare segments and find causes. Filters and the ability to drill down matter most here.
Dashboards by business area
- Marketing and advertising: website traffic, leads by source, cost per lead, ROAS by campaign.
- Sales: deal pipeline, win rate, lead response time, revenue per salesperson.
- Online shop: orders, average order value, cart abandonment rate, best-selling products.
- Team and project management: workload, overdue tasks, delivery pace.
- Customer support: open tickets, average handling time, customer satisfaction.
Who builds dashboards and what the process looks like
You can build a simple dashboard yourself, and we will get to that below. In large companies a whole team works on it, and the process breaks down into four stages. Even if you run a small business, it is worth going through the same stages, just faster.
Stage 1: Understand what the user needs
The user is whoever will make decisions based on the dashboard: the CEO, the marketing manager or the head of sales. At this stage a business analyst interviews them, learns which decisions they make and what gets in their way today, studies the business processes and writes down requirements: which metrics appear, how they are broken down and how often they refresh.
Stage 2: Define where the data comes from
At this stage you decide:
- Which data you need. For example, to show campaign profitability you need both the ad spend and the revenue from the deals that campaign produced.
- What the sources are. Some data lives in systems, and some is collected manually by employees. Sometimes you need both.
- How each metric is calculated. What counts as a lead: every form submission, or only forms with a valid phone number? When is a deal considered closed? Which values are good and which are bad? Without clear definitions, two people will calculate the same metric and get different numbers.
Stage 3: Solve the technical questions
A systems architect or developer decides where the data will be stored, how it will move between systems and how often. In parallel, a UX/UI designer plans how the dashboard will look: the order of the blocks, chart types, filters and mobile behaviour. In small businesses one person often does both jobs.
At this stage it is also worth deciding who can see what. If the dashboard shows personal data, such as names, emails or purchase histories of individual customers, data protection rules like the EU's GDPR apply to it just as they apply to the CRM it comes from. In practice that means showing aggregated figures wherever you can, limiting access to people who need it and keeping data only as long as it is useful. This is general guidance, not legal advice.
Stage 4: Build, test and launch
All decisions are documented and handed over for the build. Once the dashboard is ready, it is tested: do the numbers match what the source systems show, does everything load quickly and what happens when there is no data? Only then is it launched and the team trained to use it.

How to build a dashboard yourself: step by step
Most small businesses do not need a months-long project. You can launch a first useful dashboard in a few days if you work in the right order.
Step 1: Start with decisions, not data
Write down three to five decisions you make regularly. For example: "which ad channel deserves more budget", "do we need another salesperson", "which products should we promote this month". For each decision, ask: which number would help me decide? That gives you a short, relevant list of metrics.
Step 2: Choose five to nine key metrics
More than that is hard to read at a glance. For each metric, write down a precise definition, the data source, the refresh frequency and a target value. In marketing these are usually leads by source, cost per lead, conversion rate and ROAS; in sales, win rate and lead response time.
Step 3: Map your sources and connect them
Note where every piece of data lives: GA4, Google Ads, Meta Ads, the CRM, the invoicing system or the shop. Check whether your dashboard tool has a ready-made connector for each source. Anything without a connector can be sent to a Google Sheets spreadsheet with n8n or Make, and from there into the dashboard.
Step 4: Sketch it on paper
Before you open any tool, draw the screen. Put the most important numbers large at the top, trend charts below them and detailed tables at the bottom. A sketch saves hours of dragging blocks around later.
Step 5: Build a first version
Build the dashboard in the tool you chose, following the sketch. Do not spend time on visual polish yet: the goal is to check that the numbers are correct and that people actually use them.
Step 6: Test and improve
Compare the numbers with the source data. After two weeks of use, ask the team what they look at, what is unclear and what is missing. Remove blocks nobody looks at. A dashboard is a living product, not a one-off project.
Tools for building a dashboard
Tools you probably already have
- Google Sheets or Excel. Good for a personal dashboard or a very small business: you enter data, summarise it with formulas and add charts. It is simple and cheap, but it needs manual work and breaks down when the data grows.
- Built-in dashboards in your systems. GA4 has reports and Explorations, Google Ads and Meta Ads Manager have custom reports, and CRMs such as HubSpot and monday CRM have built-in dashboards. They work well for one area, but each one shows only its own system.
Dedicated BI tools
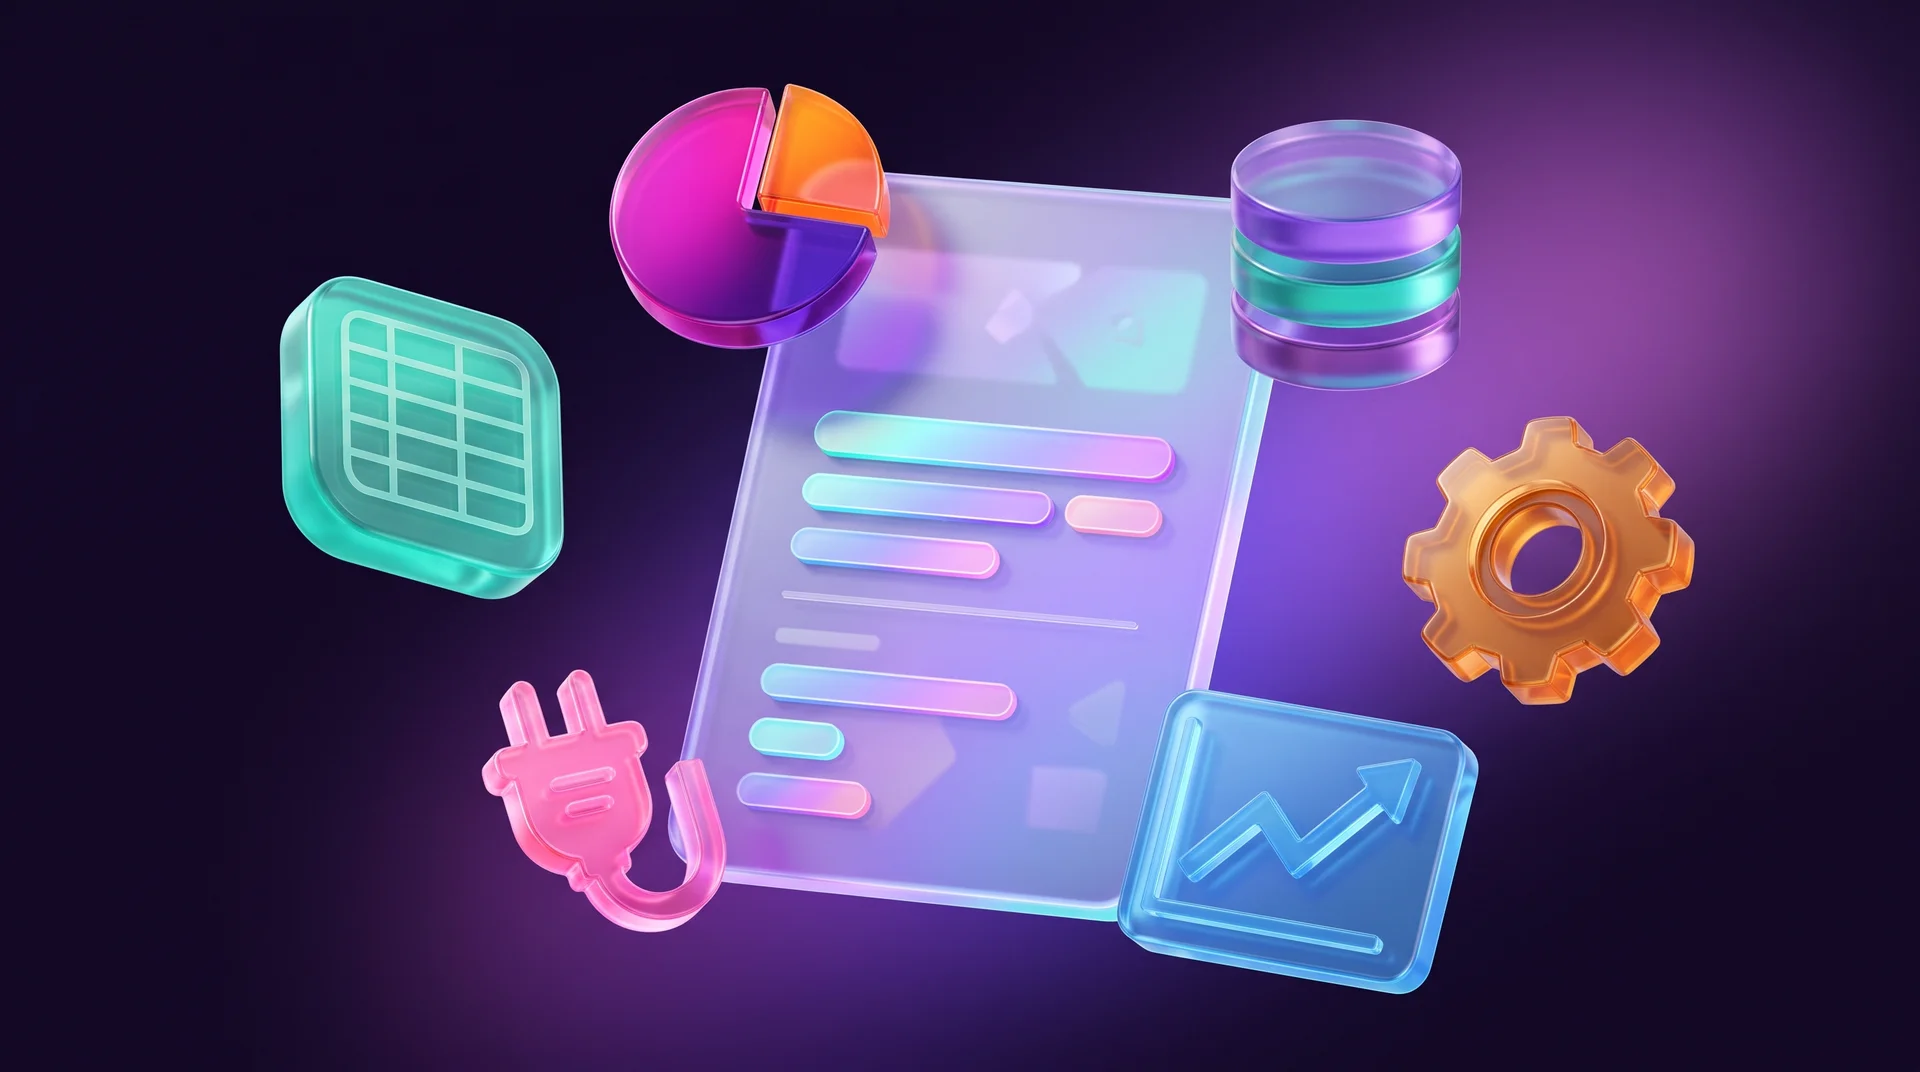
BI (business intelligence) systems collect, process and display data from several sources in one place.
- Google Looker Studio. A free tool with ready-made connectors for GA4, Google Ads, Search Console, BigQuery and Google Sheets. An excellent starting point for businesses whose marketing runs on Google tools.
- Microsoft Power BI. Especially strong for businesses that work in Microsoft 365 and Excel. There is a free Desktop version and paid plans for sharing across the organisation.
- Tableau. A long-established tool with rich visualisation options, common in large companies.
- Qlik and Metabase. Qlik suits organisations with large volumes of data, while Metabase is an open-source tool you can host on your own server.
When you need a custom dashboard
Sometimes an off-the-shelf tool is not enough: you need to show data inside a client area on your website, combine it with actions (for example, approving an order directly from the screen) or meet specific security requirements. In those cases a dedicated dashboard is built with React and an API, or inside the website's admin interface.
How to design a dashboard that is easy to read
There are no rigid rules, but there are principles that work. Edward Tufte, a well-known researcher of information design, argued that a visualisation should maximise useful information and remove every unnecessary graphic element. In practice this means:
- The most important thing goes at the top. The eye scans a screen from the top. In left-to-right languages it starts at the top left; in right-to-left interfaces it starts at the top right. Put your main metric there.
- Context for every number. "152 leads" says little. "152 leads, 18% more than last month, target 170" says everything.
- Colour only when it means something. Red for a problem, green for success, neutral shades for everything else. A dashboard that is too colourful hides what matters.
- The right chart type. Show trends over time with a line chart, comparisons between categories with bars, and use a pie chart only when there are just a few slices.
- Consistency. The same colours for the same channels in every chart, and the same formats for dates and currency throughout.
- Mobile. Many business owners check their numbers on their phones. Make sure the key metrics are readable on a small screen.
Common mistakes when building a dashboard
Putting everything in
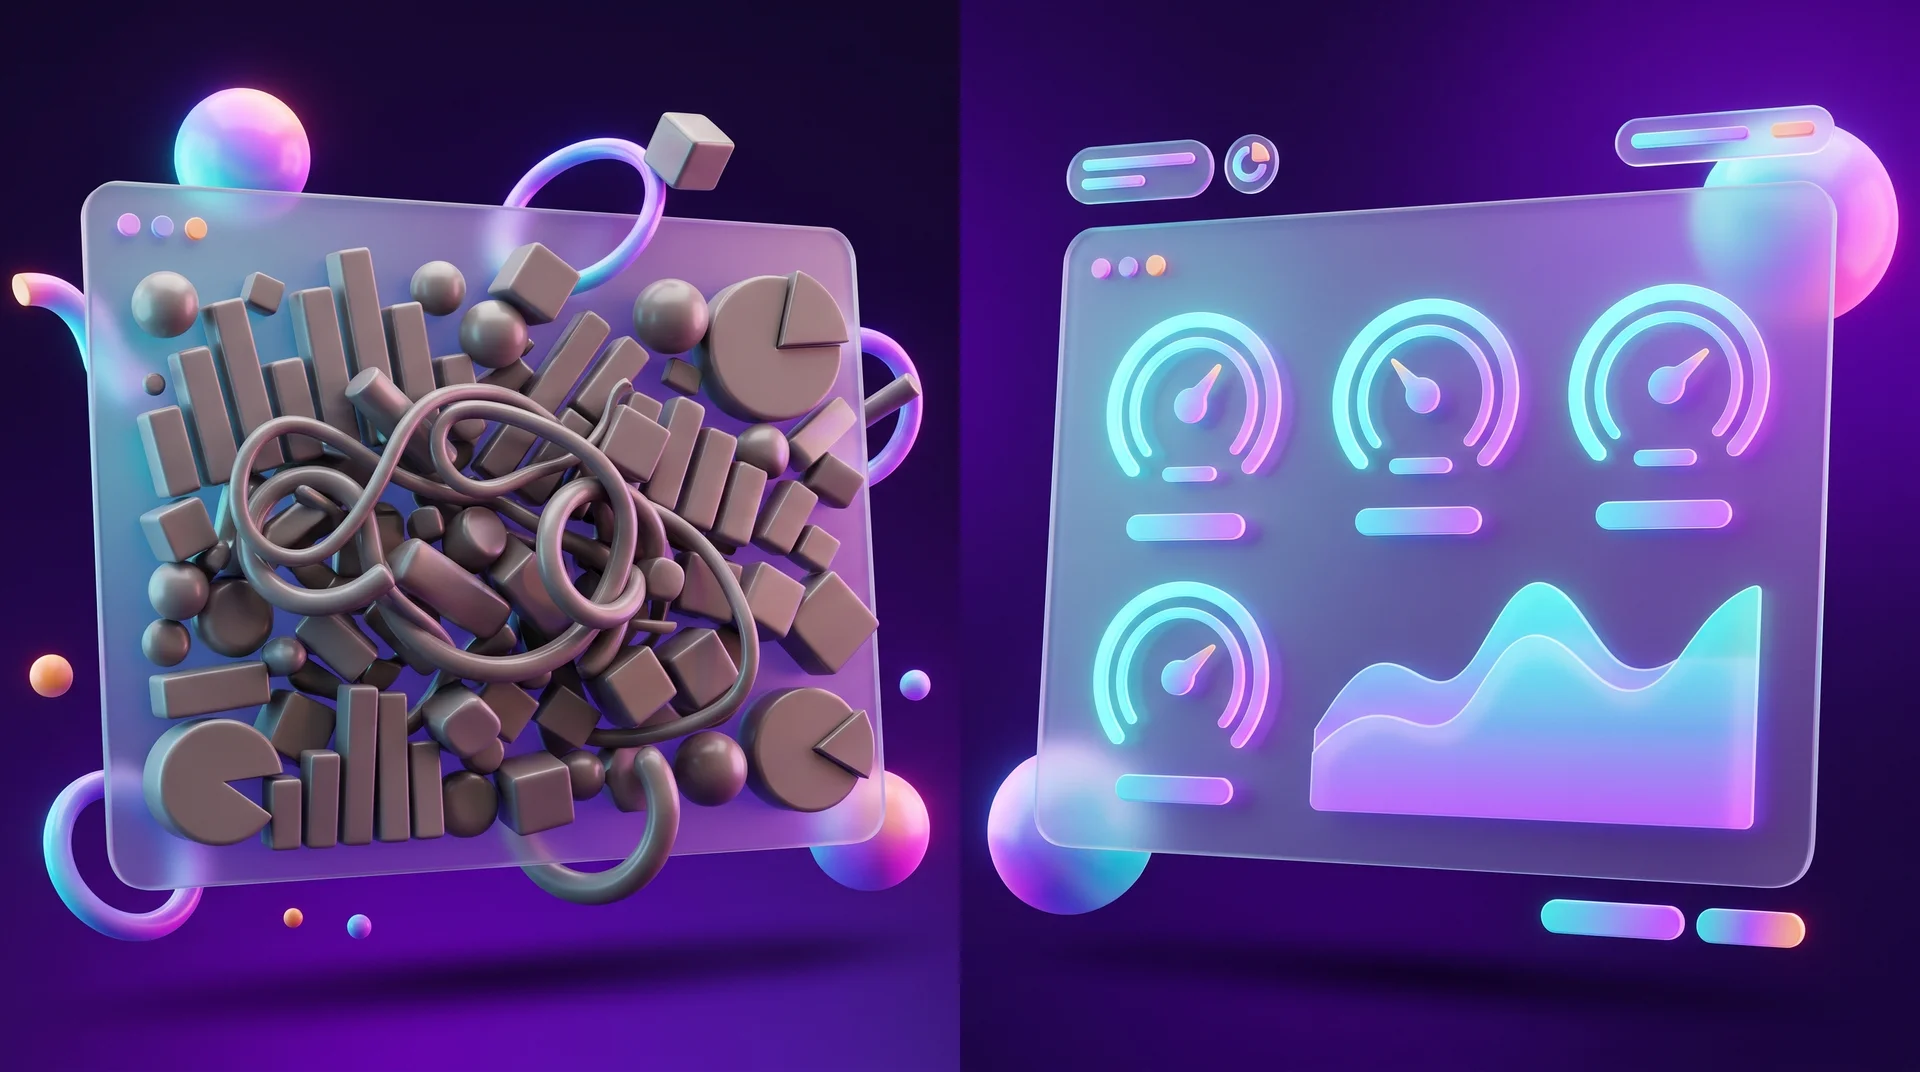
When you try to show every piece of data that exists, you get a crowded screen nobody reads. A dashboard is not a warehouse of reports. If a metric does not help anyone make a decision, it does not belong there.
Vanity metrics
Followers, page views and impressions look good, but they rarely tell you how much money the business made. Prefer metrics tied to outcomes: qualified leads, deals, revenue and customer acquisition cost.
No shared definitions
Marketing counts every form as a lead, while sales counts only people who answered the phone. The dashboard shows one number and neither team trusts it. Write a short metrics glossary and agree on it with everyone who uses the data.
Unreliable data
If tracking on your website is set up incorrectly, the whole dashboard is built on sand. Duplicate events in GA4, forms that are not tracked or leads that arrive without a source, and every number becomes misleading. Before you build a dashboard, audit your measurement.
Build it and forget it
Businesses change: a new channel opens, the product evolves, the CRM gets replaced. A dashboard that is not maintained loses its relevance within months. Schedule a review once a quarter.
How RJL Studio helps you build a business dashboard
At RJL Studio we start with the foundations: we set up correct website measurement in GA4 and Google Tag Manager and make sure every lead reaches your CRM together with its source. Then we connect data from your website, ad platforms, CRM and other systems using APIs, webhooks and n8n, Make or Zapier, and build the dashboard in Looker Studio or whichever tool suits you. When it makes sense, we also design a dedicated dashboard inside your website's admin area, with a strong focus on a clear user experience.
Want to see all of your business numbers on one screen? Read about our automation and integration services and UX/UI design, or get in touch and we will get back to you.
Frequently asked questions
Do I need to be an analyst to build a dashboard?
Not necessarily. Tools such as Looker Studio and Power BI handle most of the technical work and come with ready-made connectors. You do need an analytical mindset, though: to understand which metrics matter, how they are calculated and what the numbers are telling you. For a complex dashboard with many sources, it is better to work with someone who knows the field.
How long does it take to build a dashboard?
A basic marketing dashboard in Looker Studio connected to GA4 and Google Ads can be built in a few days. A dashboard that combines several systems, including a CRM and a finance system, and needs data cleaning and a metrics glossary can take several weeks. Most of the time goes into defining metrics and connecting data, not into visual design.
What is the difference between a dashboard and a report?
A report is usually a detailed document for a specific period, prepared manually or automatically. A dashboard updates continuously, shows only the key metrics and lets you drill down when needed. In practice they complement each other: the dashboard shows that something happened, and the report explains why.
How many metrics should a dashboard have?
Usually five to nine key metrics per screen. If you have more, it is better to split them into several dashboards by audience or area: one for management, one for marketing and one for sales. Every user should see what is relevant to them without having to search for it.
Can I build a dashboard for free?
Yes. Looker Studio is free, and Google Sheets and Power BI Desktop also let you build a dashboard at no cost. Costs appear when you need paid connectors for systems without a built-in integration, a data warehouse for large volumes, or the working hours of whoever sets everything up and maintains it.
Disclaimer: blog content is for general information and learning only and is accurate as of its publication date. It is not professional, legal, financial or business advice, nor a recommendation or call to take any action. Any use of this information is at the reader's own risk, and we accept no liability for any resulting loss. Links to external websites and tools are provided for convenience only. We recommend consulting a qualified professional before making decisions.